

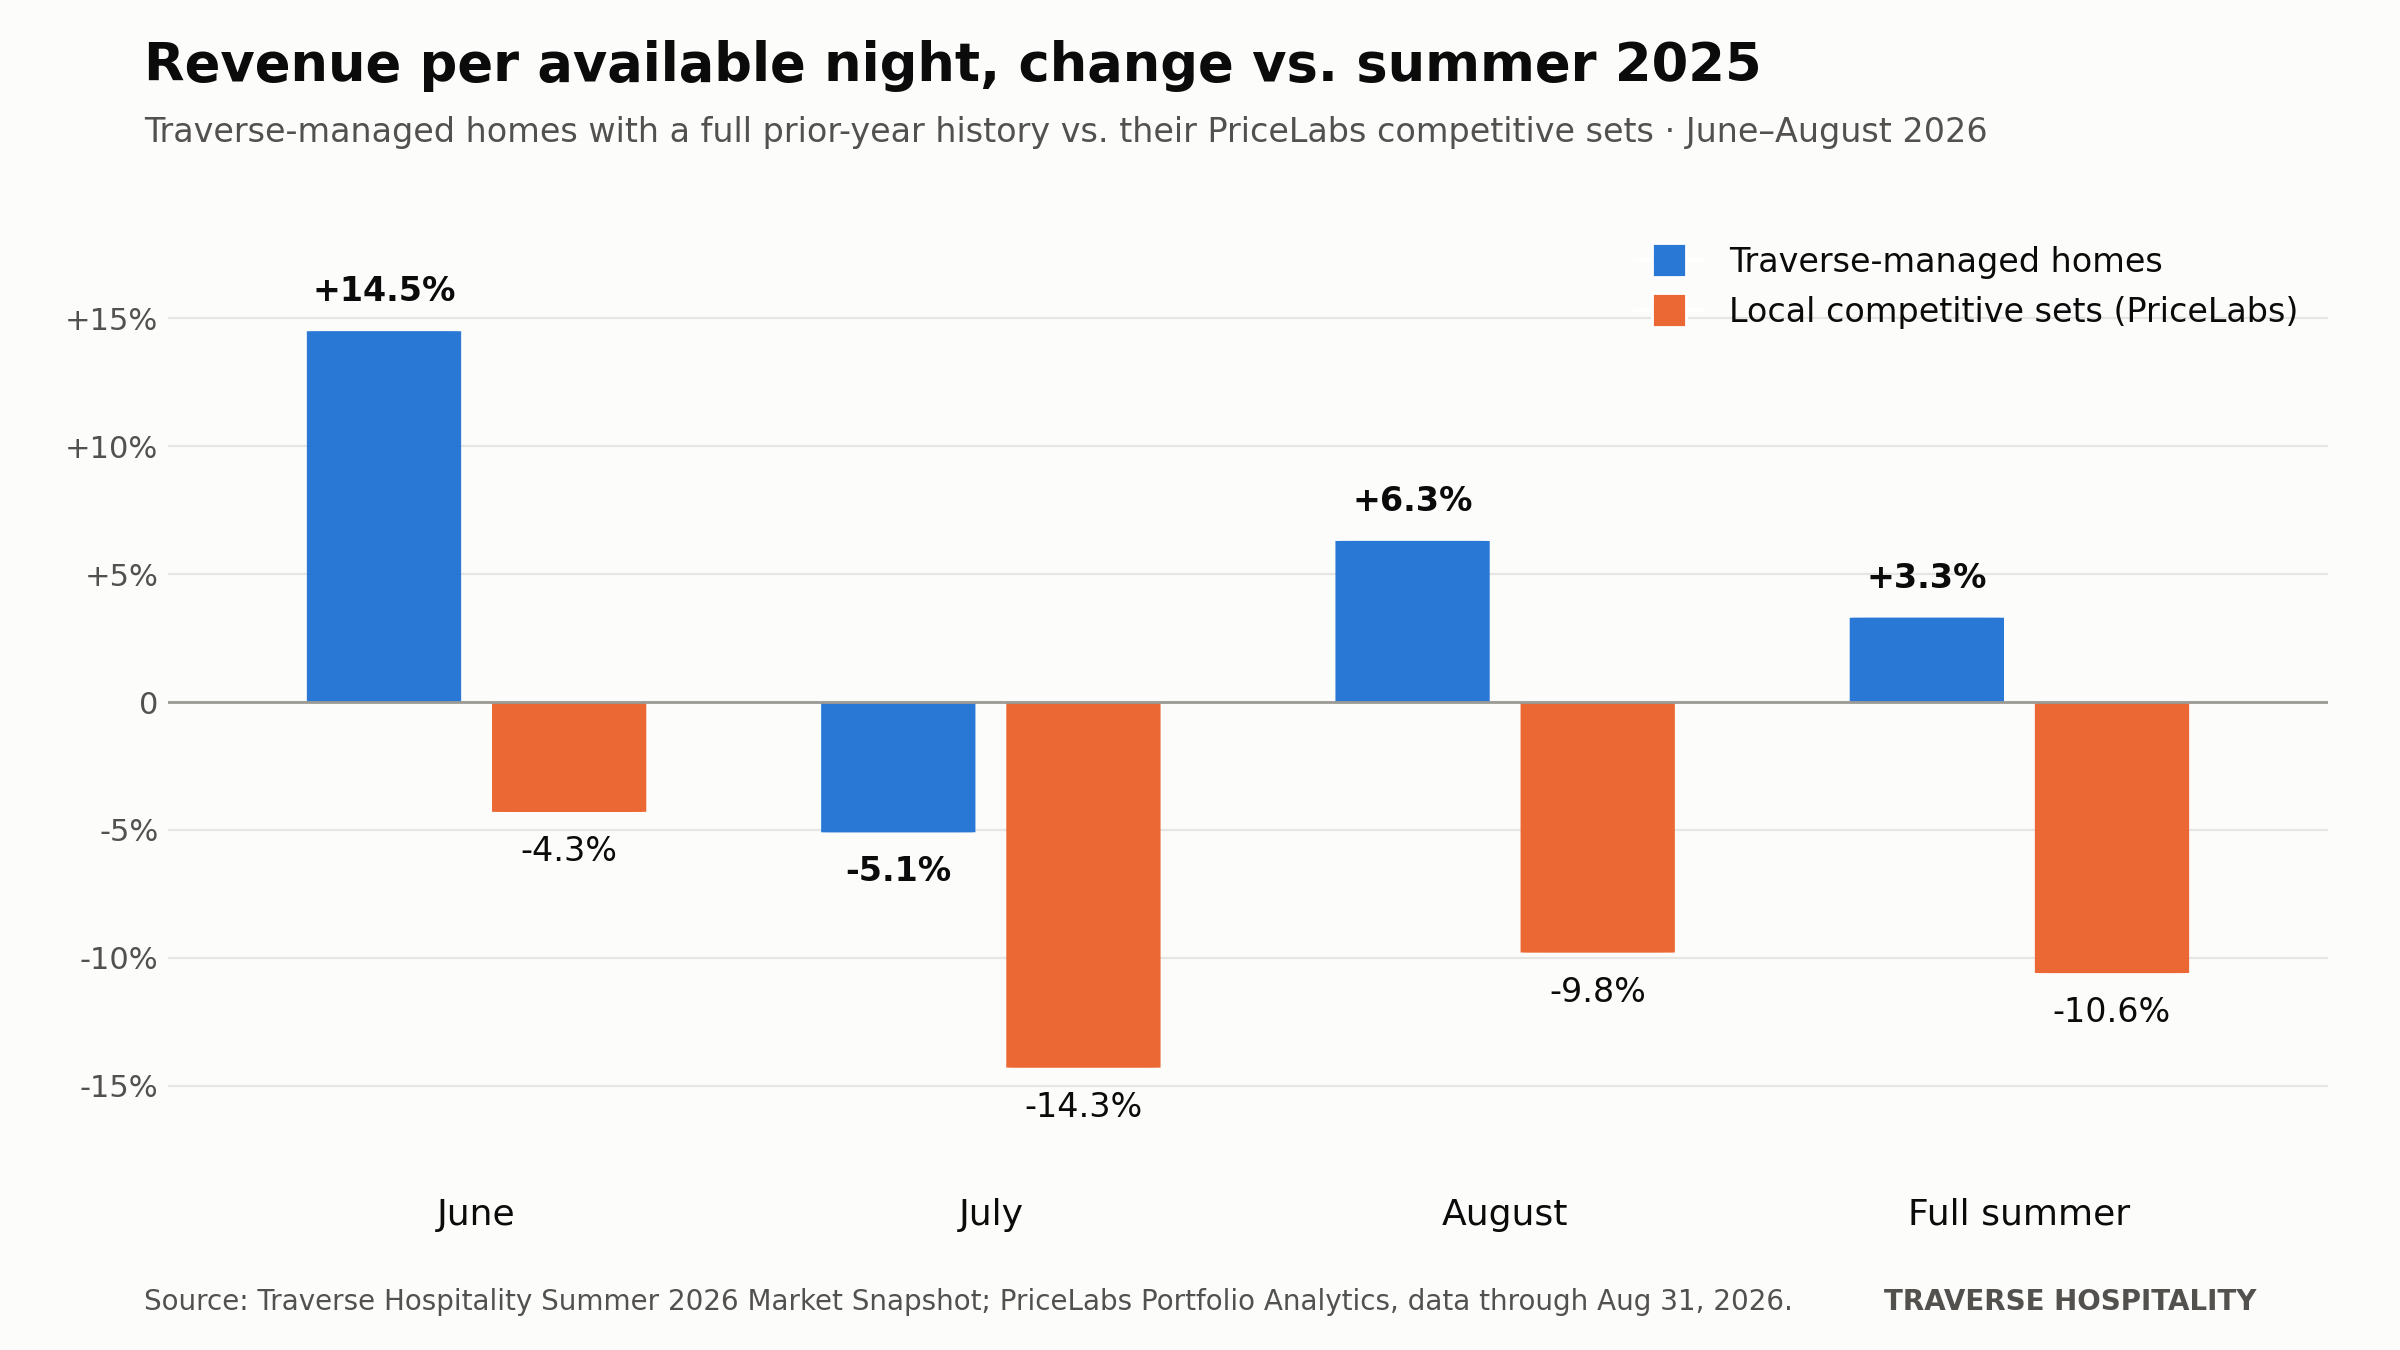
A note to owners. This summer was a useful test of how a managed home holds up when demand softens. Across the West, June ran ahead of last year, July fell off sharply as travelers delayed plans, and August recovered only part of the way. In the competitive sets around the mountain homes we manage, occupancy fell every month and revenue per available night finished the season down 16.0% against 2025. Nearby hosts trimmed rates by about five percent and still filled roughly eight points less of their calendars; the market gave up both rate and nights.
The Colorado mountain homes we have managed for more than a year finished differently: occupancy 2.9 points below last summer, average nightly rates 7.0% higher, and revenue per available night up 2.7%. About six in ten of those homes beat their competitive set, a quarter matched it, and one in seven fell short. The results were good, not uniform, and this report says so where it applies.
This edition covers our Colorado mountain markets, Leadville, Twin Lakes, Crested Butte, Granby and the Vail Valley, so that the comparison reflects the market most owners share. Homes in Denver, Frisco, Des Moines and Florida are reported to their owners separately.
01 · The market this summer
Nationally, AirDNA's mid-year outlook described a market in balance: demand and supply each growing about 2.7% for 2026, occupancy near 57.4%, and travelers booking later, staying shorter, and favoring larger homes. Mortgage rates above six percent are slowing new listings, which helps established operators hold pricing.
In the western mountains, DestiMetrics reported a strong June (occupancy up 2.4%, rates up 4.9%) and then the turn: bookings taken during June for July arrivals were down 13.1%, and for August arrivals down 12.6%. Shoulder-season pace was sharply positive, with September bookings up 27% and October up 23%.
Locally, the Gunnison-Crested Butte Tourism and Prosperity Partnership told the Crested Butte News in late May that summer was tracking flat against 2025, strong at the beginning and end and soft in the middle. Our PriceLabs competitive-set data agrees, with more precision: market occupancy fell three points in June, fourteen in July, and seven in August, while market nightly rates fell about five percent. July was the weakest month, with local competitors filling fourteen points less of their calendars than a year earlier while cutting rates about five percent; a home on a fixed seasonal rate card lost occupancy without gaining rate, and when it discounted, it gave up rate without winning the nights back.
02 · How Traverse homes performed
The gap to market held in every month rather than resting on one good one. In June, Traverse-managed homes grew revenue per available night 14.7% while comp sets fell 9.2%. In July, the portfolio declined 7.0% against a comp-set decline of 22.3%. In August, the portfolio grew 6.9% against a comp-set decline of 14.6%. For the full summer the portfolio finished up 2.7% and comp sets down 16.0%. Of the 82 mountain homes with a full prior-year history, 51 outperformed their comp set, 19 were at par and 12 underperformed.
Portfolio occupancy ran roughly ten points above comp sets in each month, 70% vs 58% in June, 71% vs 65% in July, 74% vs 61% in August, but was itself below 2025 in July by twelve points, in line with the market-wide decline. The year-over-year gain came from rate: nightly rates rose 11.7% in June, 8.7% in July and 3.9% in August, 7.0% for the season, while comp-set rates fell between four and six percent each month. Higher rate alongside modestly lower occupancy is the signature of pricing that adjusts to demand night by night rather than a seasonal rate card.
By segment, Leadville one-bedrooms held per-night revenue roughly flat (+1.7%) in a market that fell more than 23%; three-bedrooms were flat against a market down 17%; two-bedrooms declined 4.5% against a market down 18%. Twin Lakes three-bedrooms and Granby homes posted gains while their markets declined, and Crested Butte one-bedrooms gave up 9% against a market down 16%. Leadville four-bedrooms were the exception, down 12.5% against a comp set down 12%, and those homes are being reviewed individually.
03 · What drove the difference
Pricing that moves with demand. Every home is repriced daily through PriceLabs and reviewed by the revenue team against local knowledge: event weekends, wildflower season, a mid-summer lull. Booking behavior shifted with it. Among reservations created in August, the share made within three days of arrival fell from 38% to 26%, bookings made two weeks to two months ahead rose from 24% to 38%, and one-night stays fell from 25% of bookings to 10%.
Listings built to be found, and more places to find them. Listing content was rewritten around how Airbnb and Vrbo rank properties, with professional photography standard for new homes. Distribution broadened: Airbnb's share of new bookings fell from 76% to 58% between August 2025 and August 2026 as Expedia and Booking.com were added, Vrbo grew, and direct bookings reached about one in ten reservations.
Reviews, requested after every stay. Every departure gets a review request, every review gets a response, and operational issues surfaced in reviews are routed to cleaning and maintenance the same week. The portfolio's average guest rating across channels was 4.88 for August 2026, which is what supports the occupancy premium and the ability to hold rate in a soft month.
04 · Fall and winter outlook
Regional indicators for the shoulder season are positive, and the winter book for December through March is building earlier than a year ago. The plan follows from the summer data: hold base rates into September rather than discount early, test modest weekend and holiday increases on the larger Leadville homes, where low-70s occupancy alongside RevPAR growth suggests some rate headroom, keep broadening distribution in Crested Butte, and track cancellation rates by channel now that the mix has changed.
About the data
This edition covers Traverse-managed homes in Colorado mountain markets: Leadville, Twin Lakes, Crested Butte, Granby, Vail and Avon. Homes in Denver, Frisco, Des Moines and Panama City Beach (eight with a full prior-year history) are excluded from every portfolio and comp-set figure. Occupancy, average nightly rate and revenue per available night come from PriceLabs Portfolio Analytics for June 1 – August 31, 2026, compared with the same dates in 2025, refreshed September 21, 2026. Year-over-year comparisons cover the 82 mountain-market homes with a full prior-summer history; homes blocked for more than 90% of the period are excluded. "Comp set" means the nearby listings of similar size and type PriceLabs identifies for each home. Booking-window, length-of-stay and channel figures are computed from reservation records for bookings created in August 2026 and August 2025. Market context: AirDNA mid-year outlook (July 8, 2026); Inntopia / DestiMetrics briefing (July 16, 2026); Crested Butte News (May 27, 2026). The full methodology is on the last page of the PDF. Individual property results vary; an owner's monthly statement remains the record for their home.